
- Employee
- 25/04/2025

TU/e employees still satisfied, but workload remains high
Three years after the first Employee Experience Survey (EES), a new report has been released on TU/e employees’ satisfaction and well-being. The results paint a mixed picture. On the one hand, a majority still experiences a high workload, and there has been an increase in undesirable behavior. On the other hand, the work and the employer receive solid marks.
How would you rate your working experience at TU/e? What factors influence your workload? And how do you feel about your supervisor’s performance? These are a few of the questions included in the Employee Experience Survey (EES) that was conducted in February and completed by more than half of all TU/e employees. The results show that employees give working at TU/e an average rating of 7.8. They give their employer a 7.6.
The ratings for both the work and the employer are consistent with those from three years ago, when the Employee Experience Survey (EES) was first conducted. At 58 percent, the willingness to participate in the survey is 10 percent higher than in 2022. The services once again had a higher response rate (75 percent) than the departments (49 percent), with outliers in Real Estate (87 percent) and Innovation Sciences (74 percent).
In addition to providing insight into overall employee satisfaction, the report also gauges areas such as engagement, workload, work-related stress, social safety, the management climate, and working conditions. The results paint a mixed picture. On the one hand, a majority still experiences a high workload, and there has been an increase in undesirable behavior. On the other hand, the work atmosphere, hybrid working arrangements and the degree of autonomy continue to be rated positively.
Workload
Employees who participated in the survey indicate that the workload experienced over the past year was often higher than what they consider to be acceptable. This result is nearly identical to the situation in 2022, when employees also reported a high workload. The figures show that academic staff (WP) experience a higher workload than support staff (OBP). Half of all respondents discuss their workload with their supervisor, of whom 60 percent report that the situation improves afterward.
On a scale of 1 (no workload) to 10 (extremely high workload), WP rate their experienced workload at 7.1, while their acceptable workload level is 6.7. For OBP, those figures are 6.6 and 6.3, respectively. In 2022, WP rated their experienced workload at 7.3 and their acceptable workload was 6.4. For OBP, those ratings were 6.9 and 5.8, respectively. As such, the experienced workload is now slightly lower than three years ago for both WP and OBP, but the acceptable workload level has increased slightly.

Interestingly, 57 percent of employees indicate that, over the past three months, they have worked more hours than specified in their contract. This figure is especially high among WP: 64 percent, compared to 48 percent among OBP. Emotional strain, such as pressure to perform, was often cited as a cause of high workload by WP, while OBP was more likely to point to work and organizational factors. These include unclear job descriptions and rapidly changing technologies, ICT and systems.
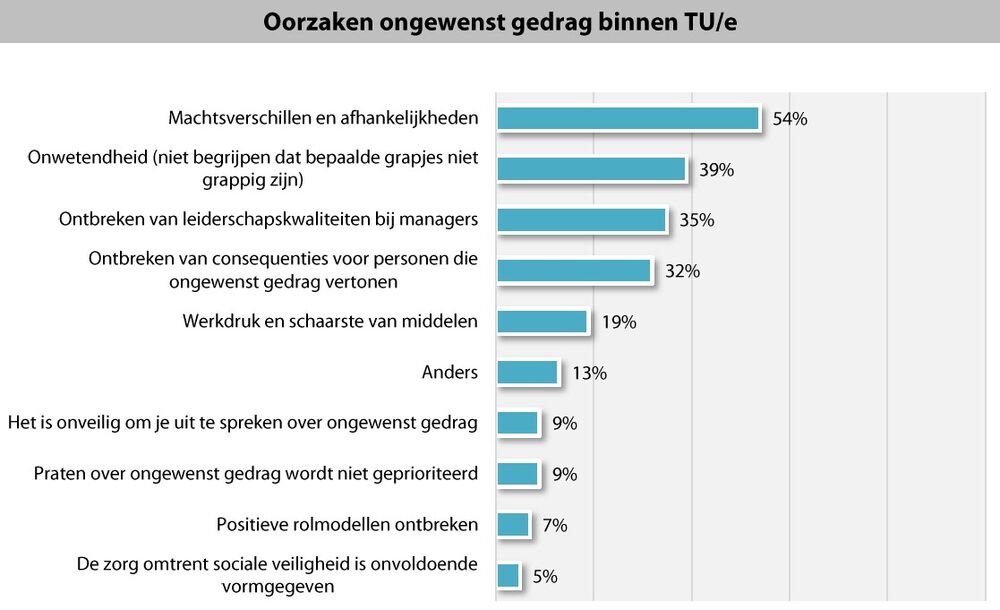
Undesirable behavior
Another notable finding is an increase in undesirable behavior compared to three years ago. This includes bullying, exclusion, aggression and violence, sexual harassment and discrimination. The proportion of respondents who have personally experienced undesirable behavior has increased from 10 percent in 2022 to 12 percent today. 19 percent reported having witnessed undesirable behavior, up from 12 percent three years ago. As such, employees still experience and witness ‘high to very high levels of undesirable behavior.’
Employees who personally experienced or witnessed undesirable behavior were most likely to select exclusion. The same was true in 2022. Reports of discrimination were more common among academic staff than among support staff: 9 and 5 percent, respectively. By contrast, aggression and violence was observed more often by OBP (6 percent) than by WP (4 percent).
The most frequently stated causes of undesirable behavior are power imbalances and dependencies (54 percent), ignorance (39 percent), lack of leadership qualities in managers (35 percent) and lack of consequences for persons displaying undesirable behavior (32 percent).

At the Eindhoven School of Education (ESoE), 46 percent of employees reported witnessing undesirable behavior, and 33 percent reported personally experiencing it – making it the department with the highest percentages. Three years ago, Industrial Design (ID) was at the top of the list with 26 percent (now 18 percent).
Among the services, the highest scores of observed undesirable behavior are 25 percent (at EPC) and 24 percent (at LIS). In 2022, the Executive Board had the highest figure (31 percent), followed by CEC (24 percent). The Executive Board includes the 9 department deans and the 21 managing directors of the departments, services, TU/e Innovation Space and the Student Sports Center.
Of the employees who witnessed undesirable behavior, 77 percent indicated that they reported it, most frequently to their supervisor (51 percent). Only 1 percent of these reports reached the Integrity & Social Safety Desk. 75 percent of survey participants who personally experienced undesirable behavior also reported it, again, most frequently to their supervisor. Of these, 4 percent turned to the Integrity & Social Safety Desk.
Work atmosphere and autonomy
Just like three years ago, employees report being satisfied with the level of autonomy they experience in their work, with an average score of 4.1 on a scale of 1 to 5, both at the departments and services.
The work atmosphere and appreciation for supervisors are also rated the same as in 2022: a score of 3.8. And while diversity and inclusion are no longer a given in the U.S. due to the political climate there, differences between employees at TU/e are even slightly better respected today (4.1) than they were three years ago (4.0).
Hybrid working also continues to score well (3.4 WP and 3.9 OBP). Most people who work hybrid have access to a proper home office setup. Engagement at TU/e has grown, with a score of 3.9, up from 3.7 in 2022. However, slightly more employees reported sick this past year compared to 2022. More than half of all respondents (54 percent) indicate that they continued working while being sick in the past year.
Discussion